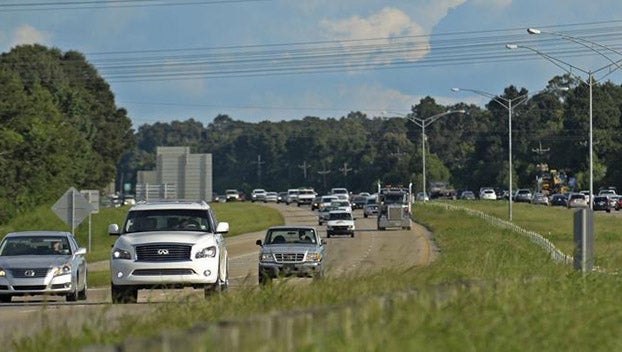
Traffic deaths are on the rise in the United States, according to a recent report from the National Highway Traffic Safety Administration. An estimated 20,175 people were killed in motor vehicle crashes from January through June 2022, the most in the first half of any year since 2006. (Here is a look at the deadliest year for car wrecks since seat belts became law.)
The latest increase in traffic fatalities comes as Americans are spending more time on the road. U.S. drivers traveled 43.2 billion more miles in the first half of this year compared to the same period last year.
Some states stand out for having especially high traffic fatality rates so far this year. According to the NHTSA, there were an estimated 432 traffic fatalities in Louisiana in the first half of 2022, the 18th most among states.
After adjusting for vehicle miles traveled, however, Louisiana has the fourth highest traffic fatality rate in the country – with 1.59 roadway deaths for every 100 million miles traveled. For context, there were an estimated 1.27 deaths per 100 million miles nationwide in the first half of the year.
| Rank | State | Traffic deaths per 100M VMT, first half of 2022 | Total traffic deaths, first half of 2022 |
|---|---|---|---|
| 1 | South Carolina | 1.71 | 517 |
| 2 | Mississippi | 1.64 | 341 |
| 3 | Arkansas | 1.63 | 286 |
| 4 | Louisiana | 1.59 | 432 |
| 5 | Florida | 1.58 | 1,951 |
| 6 | New Mexico | 1.58 | 210 |
| 7 | Delaware | 1.58 | 76 |
| 8 | Tennessee | 1.56 | 636 |
| 9 | Texas | 1.5 | 2,183 |
| 10 | Oregon | 1.45 | 250 |
| 11 | North Carolina | 1.44 | 806 |
| 12 | West Virginia | 1.43 | 121 |
| 13 | Kansas | 1.41 | 205 |
| 14 | Georgia | 1.4 | 901 |
| 15 | Nevada | 1.39 | 194 |
| 16 | Alabama | 1.36 | 486 |
| 17 | Kentucky | 1.34 | 335 |
| 18 | Colorado | 1.32 | 339 |
| 19 | California | 1.29 | 2,149 |
| 20 | Nebraska | 1.26 | 127 |
| 21 | Maine | 1.26 | 86 |
| 22 | Missouri | 1.23 | 472 |
| 23 | Alaska | 1.23 | 34 |
| 24 | Oklahoma | 1.22 | 274 |
| 25 | Hawaii | 1.22 | 63 |
| 26 | Vermont | 1.21 | 40 |
| 27 | Connecticut | 1.2 | 196 |
| 28 | Illinois | 1.19 | 612 |
| 29 | Washington | 1.19 | 346 |
| 30 | Pennsylvania | 1.18 | 558 |
| 31 | Virginia | 1.16 | 481 |
| 32 | Arizona | 1.16 | 436 |
| 33 | Montana | 1.13 | 72 |
| 34 | Michigan | 1.1 | 516 |
| 35 | Indiana | 1.1 | 455 |
| 36 | Ohio | 1.05 | 578 |
| 37 | Wyoming | 1.03 | 51 |
| 38 | New Hampshire | 1.02 | 65 |
| 39 | Iowa | 0.97 | 152 |
| 40 | Maryland | 0.96 | 264 |
| 41 | New York | 0.95 | 516 |
| 42 | New Jersey | 0.93 | 342 |
| 43 | Wisconsin | 0.92 | 280 |
| 44 | Utah | 0.91 | 153 |
| 45 | Idaho | 0.91 | 85 |
| 46 | North Dakota | 0.89 | 39 |
| 47 | South Dakota | 0.88 | 45 |
| 48 | Massachusetts | 0.68 | 204 |
| 49 | Minnesota | 0.68 | 187 |
| 50 | Rhode Island | 0.38 | 14 |


